

You can see Amazon price history in two places: on Amazon's own product pages, and in an independent price tracker that records prices over time. Amazon's built-in view covers up to a year in the U.S. A tracker adds alerts, so you don't have to keep checking. Both answer the same question: is this price actually good, or does it only look good?
Below, we walk through each method, show you how to read a chart without being fooled by it, and explain why Amazon prices move so often.
TL;DR
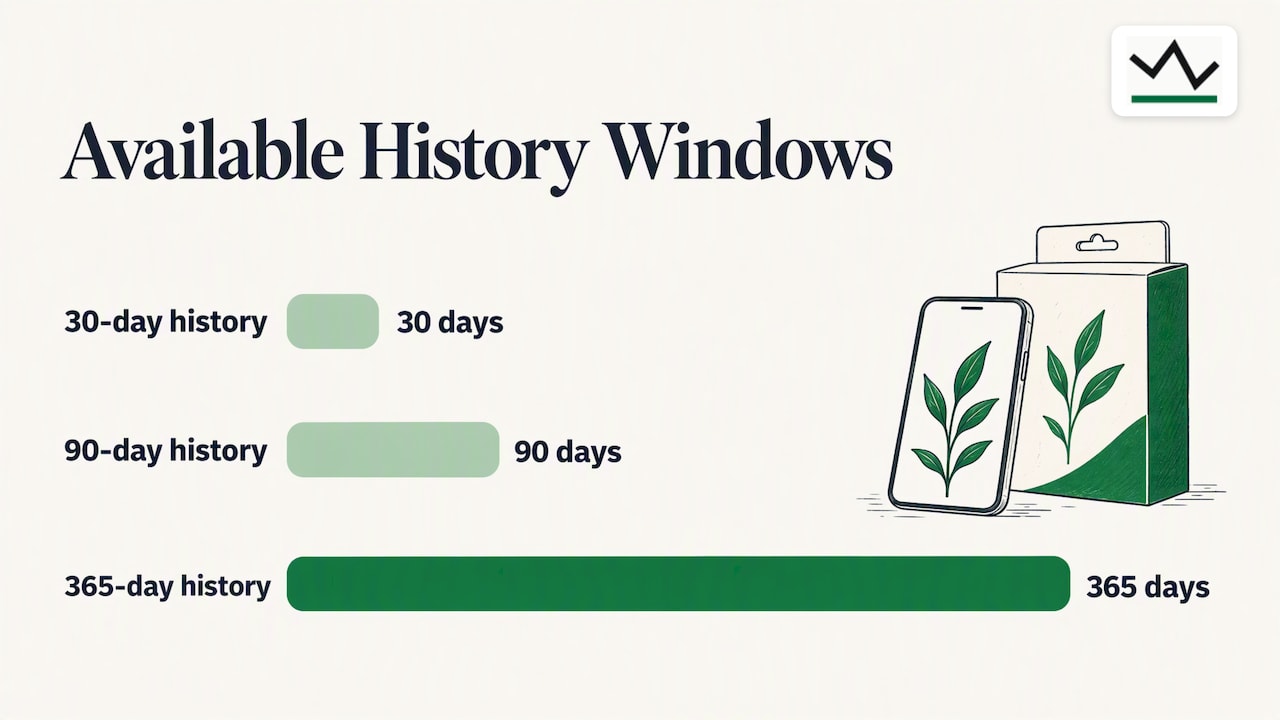
- Amazon's shopping assistant shows 30, 90 and 365 days of price history on product pages in the U.S.
- A chart tells you the lowest price, the typical price and how often the item goes on sale. Compare today's price to those, not to the crossed-out "was" price.
- Prices move because of demand, timing and seller competition, so one-day checks mislead. Look at 90 days at least, and a full year for seasonal items.
- Set an alert at your target price and let the tracker do the watching. Ours works with browser notifications and needs no sign-up.
Table of Contents
- Three ways to see Amazon price history
- How to read a price history chart
- Spotting a fake discount
- Why Amazon prices fluctuate
- What to look for in a price tracker
- Our view: a price is only a deal if the record says so
- Step by step: check history and set an alert
- Where history helps most
- Start with a price you can trust
- FAQ
- Sources
Three ways to see Amazon price history
1. Amazon's built-in price history
Amazon now offers this itself. According to Amazon's own explanation, the feature lets customers in the U.S., UK and India view 30, 90 and 365 days of price history on product detail pages, and more than 50 million customers have used it since its 2024 launch (figures as of May 2026).
It is the fastest check when you are already on a product page. The limit is scope: it shows you the history for that one listing, inside Amazon, and it will not notify you when the price falls.
2. An independent tracker
A tracker records prices on its own schedule and plots them as a chart. The best ones add three things Amazon's view does not:
- Alerts when the price drops to a number you choose.
- Back-in-stock notices for items that keep selling out.
- A record you can audit, built from the tracker's own readings rather than from a seller's claim.
Our Amazon price tracker does all three. You can read more about how we handle Amazon listings on our Amazon price tracking page.
3. The manual method
If you want no tools at all, you can screenshot or note the price today, check again every few days and compare. It works for one item you are watching closely. It fails for anything you track for weeks, because you will forget, and you will miss the short dips that last a few hours.
| Method | Best for | Alerts | History depth |
|---|---|---|---|
| Amazon's built-in view | A quick check on one product page | No | 30, 90 or 365 days |
| Independent tracker | Items you can wait on | Yes | Depends on the tool and when tracking began |
| Manual notes | One item, one week | No | Only what you wrote down |
How to read a price history chart
A chart is only useful if you know what to look for. Whether you see a line graph or a table of highs and lows, check these four things in order.
- The lowest price in the period. This is your benchmark. If today's price is within a few percent of it, you are close to as good as it gets.
- The typical price. Find where the line spends most of its time. If an item sits at $60 for ten months and dips to $45 twice, then $60 is the real price and $45 is a sale.
- How often it dips. Frequent dips mean you can wait. A flat line for a year means the discount you are hoping for may never come.
- The shape around events. Many items fall around big sale periods and recover afterward. A 365-day view shows whether that pattern is real for your product.
A longer window matters here. Thirty days can show you a recent bump, but only 90 or 365 days show whether the item has been cheaper and when. Our guide to checking price history before you buy explains how 90-day and 365-day lows differ in practice.
Spotting a fake discount
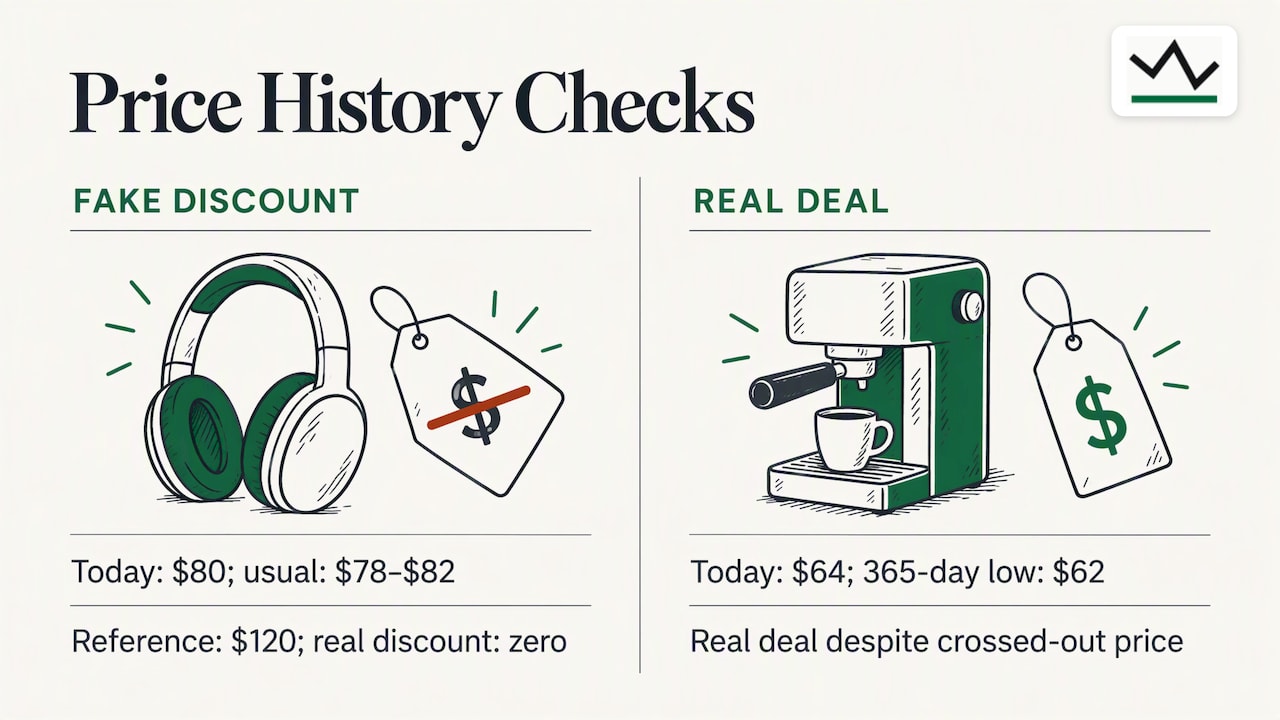
The crossed-out price next to an item is not a record of what it sold for. It is a reference price, and it can be higher than the item ever actually cost. History lets you test it.
Take a worked example. A listing shows $80, crossed out from $120, "33% off." You open the history and see the item at $78 to $82 for the past year. The real discount is zero. The chart says you are paying the usual price.
Now reverse it. The same item shows $64 and the history says its lowest in 365 days is $62. That is a real deal, whatever the crossed-out number says.
This is the reason we publish records built from our own readings. A merchant's "was" price is a claim. A recorded price is a fact you can check. We cover the step-by-step in how to verify the "was" price.
Why Amazon prices fluctuate
If you have watched a product's price jump around, you are not imagining it. Retailers often use dynamic pricing, where prices shift with demand, time and competition. A guide to Amazon price tracking makes the same point, and suggests using history to anticipate when an item usually reaches its lowest annual price.
In practice, the movement comes from a few causes:
- Demand and stock. Popular items can climb when stock is thin and fall when it is plentiful.
- Seller competition. Many listings have several sellers, and automated repricing tools adjust to each other's offers. Sellers on the platform can set automated pricing rules with a minimum price.
- Calendar events. Big sale periods pull prices down across categories. We keep pages for Amazon Black Friday 2026, the after-Christmas sales and the Big Spring Sale 2027 so you can see what has historically happened.
- Category patterns. Electronics tend to fall as new models arrive. Camping gear tends to drop when the season ends.
Consumer Reports has long advised shoppers facing this kind of pricing to use price alerts rather than buy on impulse. The article dates from 2017, but the logic has not changed.
What to look for in a price tracker
Not every tracker is built the same way. Before you pick one, check these criteria.
- Where the data comes from. Does the tool record prices itself, or repeat what the seller says?
- How long the history runs. At least 90 days, ideally a year, so you can see seasonal patterns.
- How you get alerts. Email, app and browser notifications each suit different people. If you dislike creating accounts, a browser notification with no sign-up is the lightest option.
- What the alert is based on. A drop from an inflated price is not a drop. Alerts should compare against real history.
- Back-in-stock tracking. Useful for items that sell out.
- Cost. Many trackers are free and earn money through affiliate links. Check how the tool makes money and whether that affects what it shows you.
On that last point, we are open about it: when you click through from BasketPrice and buy at a retailer, we may earn a commission. It does not change the price you pay.
Our view: a price is only a deal if the record says so
We built BasketPrice around one idea. A shopper should not have to trust a banner that says "deal." A price record should come from observed prices, collected by us, and stand on its own.
That shapes how we work. Our price records rest on our own collected price history, not on merchant claims. Our alerts can do things a simple threshold cannot, such as flag a price drop after you have bought, while you are still inside the return window. If the price falls after your purchase, you can check whether a return and repurchase makes sense. Check the retailer's return policy first, because return windows differ by item and seller.
We also think the tool should get out of your way. Browser notifications work without registration, so you can set an alert in seconds and go back to your day. Most people tracking prices are busy and don't want another login.
Our honest advice on timing: if the history shows regular dips, wait. If it shows a flat line and you need the item, buy it. A tracker is meant to save you money and also time, and sometimes the right answer is "buy now."
— Cleaning
Step by step: check history and set an alert
- Find the product. Open the Amazon listing, or paste its link into the tracker.
- Open the chart. Look at the 90-day and 365-day views, and note the lowest and typical prices.
- Compare today's price. Is it within a few percent of the low? If so, consider buying.
- Pick a target. If the item is above its usual price, set a target near the historic low, not a round number you made up.
- Turn on notifications. Allow browser alerts so you hear when it drops or returns to stock.
- Verify before you click buy. When the alert arrives, check the chart again. Our guide to verifying price drops with up to a year of data shows how.
If you buy in bulk or in multipacks, price per unit matters more than the sticker price. Our walkthrough on comparing unit prices online uses the same history in five steps.
Where history helps most
Some categories reward patience more than others. A few from our own pages:
- Electronics. Our electronics page lists typical October 2026 prices of $79 to $650, a wide spread, which is exactly why history matters. See also the best time to buy electronics.
- Smart home. Typical prices run $27 to $100 on our smart home page, and small gadgets swing by a few dollars often.
- Sports and outdoors. Seasonal gear moves with the calendar. Read the best time to buy sports and outdoor gear.
- Car care and car electronics. Everyday items where a dip of a few dollars is common. Browse car care prices.
The ranges above are what we recorded for October 2026 and will change, so check the pages for current figures.
Start with a price you can trust
If you want the history, the alerts and the verified drops in one place, start with BasketPrice. Browse Amazon prices that really fell to see what has dropped lately, or open the home page to look at car, electronics, home and sports and outdoors products and track the ones you want.
FAQ
Does Amazon show price history itself?
Yes. In the U.S., Amazon's shopping assistant shows 30, 90 and 365 days of price history on product detail pages. It covers the listing you are viewing but does not send alerts when the price changes.
How far back should I look?
Start with 90 days to see the recent pattern, then check 365 days. The longer view reveals seasonal lows that a short window hides, such as a price that falls only around big sale events.
Is a price tracker free to use?
Many are, including ours. Free trackers usually earn money from affiliate commissions when you buy through their links, so check how a tool is funded. The price you pay at the retailer is not affected.
Can the price history be wrong?
A tracker can only show what it recorded, so gaps are possible, especially for items it began tracking recently. Check how long the record runs. A long, consistent record from the tool's own readings is more reliable than a seller's stated "was" price.
Sources
- What is Amazon's price history feature and how does it work? (Amazon)
- The ultimate guide to Amazon price tracking tools (Moonsift)
- The Ultimate Guide to Amazon Dynamic Pricing in 2026 (Trellis)
- Play the Dynamic Pricing Game to Win (Consumer Reports)