

Price tracking is the practice of recording a product's price at regular intervals so you can see how it moves, then getting an alert when it falls to a number you choose. For a shopper, it replaces guesswork ("is this really a sale?") with a record: what the item cost last week, last quarter and last year. Businesses also use the term for watching competitors' prices, but this guide is about the consumer side: tracking items you want to buy.
TL;DR
- Price tracking means a tool checks a product page on a schedule, stores each price with a timestamp and shows you the result as a price history.
- You use it two ways: look at the history before buying, and set an alert so the tool tells you when the price reaches your target.
- A good deal is a price near the product's historical low, not just a big "percent off" label.
- Trackers show the listed price. Coupons, cashback and bundles are not always captured, and a chart cannot promise next week's price.
- Pair a 365-day view with a quick check of the "was" price to catch inflated discounts.
Table of Contents
- What price tracking actually is
- How price trackers collect prices
- What a price history shows you
- How to set a price alert that works
- Post-purchase tracking
- Seasonal timing and what history cannot tell you
- Why fake discounts are worth checking
- Price tracking by store
- Perspective
- Start tracking with BasketPrice
- FAQ
- Sources
What price tracking actually is
A retailer's price is not a fixed number. On large online stores it can change many times in a year, sometimes more than once a day. A price tracker watches one product page repeatedly and writes down what it sees. Over weeks, those notes become a line on a chart: the price history.
That is the whole idea, and it is more useful than it sounds. A single price tells you nothing about whether it is good. A price next to its history tells you whether it is low, normal or high for that item. From a technical standpoint, the value lies in a repeatable, timestamped series: a one-time look is only a snapshot and cannot establish a trend.
You will see a few related terms used for the same habit:
- Price history tracking: looking back at how a product's price has moved.
- Price alerts: a notification when the price drops below a threshold you set.
- Back-in-stock alerts: a notification when a sold-out item returns.
- Price monitoring: the business version, where sellers watch competitors. Same mechanics, different goal.
How price trackers collect prices
The process has four steps, and knowing them helps you read any chart critically.
- Collect. The tool visits public product pages on a schedule and reads the listed price.
- Normalize. Values are cleaned into a consistent format, so "$1,299.00" and "1299" are the same number.
- Store. Each reading is saved with its date and time. That timestamped record is the price history.
- Analyze. The tool looks for trends, lows and highs, and compares the current price with the past.
This pipeline is described in technical terms by data-collection specialists, who also note that matching the same product across different sites can take extra work, such as grouping similar titles.
How often it happens varies. One industry roundup says most established services refresh prices about once every 24 hours, with faster checks for popular items, and that many free tools limit how far back history goes. Treat those as typical figures, not rules for every tool.
Own records versus merchant claims
There is a difference between a tool that reads and stores prices itself and one that repeats what a merchant says the "original" price was. Our approach at BasketPrice is to publish price records based on our own collected readings rather than on merchant claims. That matters because the "was" price on a product page is the seller's statement, and a recorded history is an independent check on it.
What a price history shows you
Open a price history chart and look for four things.
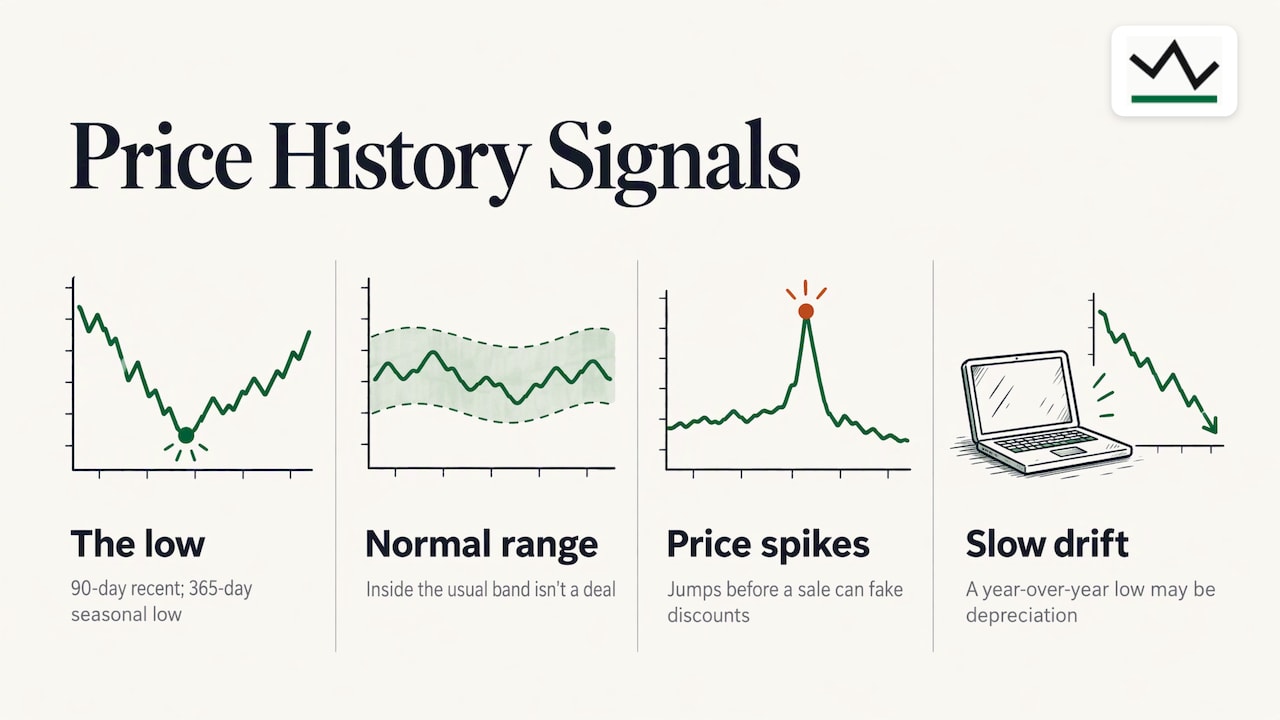
The low. The lowest point in the period is your benchmark. If you see 90-day and 365-day lows, they answer different questions: the 90-day low tells you what is normal lately, and the 365-day low shows whether a seasonal sale ever went deeper. We explain how to read both in our guide to checking the 90-day and 365-day lows.
The normal range. Many products sit in a band most of the year and dip occasionally. If the price is inside the band, it is not a deal, whatever the badge says.
The spikes. A sharp jump right before a sale is a red flag. Consumer Reports' deals editor, quoted by CBS, warns that retailers sometimes raise the original price shortly before a sale so the discount looks bigger. In her example, an iPad advertised with $50 off at $299 had frequently been listed at $299 since May, so the "discount" was just the usual price.
The slow drift. Electronics and household goods tend to get cheaper over months as models age. A price that looks low compared with a year ago may simply reflect normal depreciation and not a special sale. When you check history, compare against the recent range too.
How to set a price alert that works
An alert turns tracking into something you do not have to remember. Here is a simple routine.
- Find the product page for the exact model, size or color you want. Different variants can carry different prices.
- Read the history first. Note the 90-day low and the 365-day low.
- Pick a target. A sensible starting point is at or just above the historical low. If you need the item soon, choose the recent normal low instead.
- Turn on the alert. With BasketPrice, you can get browser notifications for price drops without signing up, and you can also ask for back-in-stock alerts.
- Decide your rule in advance. For example: buy at or under the target, or wait for the next sale cycle.
A practical rule many shoppers use is to compare the current price with the product's historical low and normal range, then weigh urgency: a near-record low may justify buying now, while a merely average price may justify waiting if you do not need the item soon.
A worked example
Suppose you want a monitor. Its 365-day range is $140 to $230, its 90-day low is $165, and today's price is $199 with a "Save 25%" badge. The badge implies a $265 original price that the history never reached. The real position: $199 is in the upper-middle of the range, $34 above the recent low. You set an alert at $170 and move on. If it hits $170, you buy with confidence; if it never does, you have lost nothing. (These figures are illustrative, not live prices.)
To see how this looks with real listings, you can browse monitor prices and their typical range.
Post-purchase tracking
Tracking does not have to stop at checkout. If a product's price falls shortly after you buy it, you may be able to get a refund or return it and buy again at the lower price, depending on the store's policy and its return window. Our alerts include a trigger for post-purchase price drops within return windows, so you know while the window is still open. Check the retailer's own return and price-adjustment terms before acting.
Seasonal timing and what history cannot tell you
History is strongest as a look backward. One chart-reading guide advises not buying at the top of a product's cycle and treating the lower bounds of a one-year history as a good time to buy. The same article notes that many items are discounted around the holidays, sometimes starting as early as September, and that big dips occur during Prime Day in late June.
Two cautions keep your expectations realistic:
- A chart answers whether the current price is lower than usual, but it is not a reliable predictor of next week's price.
- Listed prices are not always effective prices. Trackers capture the listed retail price, so a coupon, loyalty discount, card cashback or bundle can change what you really pay. Add those to your math at checkout.
Different tools can also show slightly different histories, because they vary in how often they sample, how they handle time zones and how long they keep data. That is why a long, consistently recorded history is worth looking for.
Why fake discounts are worth checking
In the United States, the Federal Trade Commission's guides on deceptive pricing say that a former price used for comparison should be the actual, bona fide price offered to the public on a regular basis for a reasonably substantial period. A fictitious higher price used to stage a discount is the thing the guides warn against.
You do not need to litigate that at the checkout. You just need a record. Compare the "was" price to the price history, and if the "was" price barely appears there, treat the discount as marketing. Our walkthrough on how to track Amazon prices and verify the "was" price covers the steps.
The same logic applies in every category. Outdoor and sporting gear stores run promotions constantly, for instance, and when you look at something like outdoor shooting gear deals, the habit is the same: note the usual price, then decide whether the advertised reduction is real.
Price tracking by store
The idea is identical everywhere, but each retailer has its own habits. We have written store-specific guides:
- How to see Amazon price history before you buy
- How to see Best Buy price history
- How to see Target price history
If you are comparing sizes or multipacks, price per unit is often a better measure than shelf price. Our five steps to compare unit prices using price history show how.
Perspective
We built BasketPrice around one belief: a price record is only worth trusting if it comes from someone who actually watched the price. Merchant claims about a "regular" price are statements, not evidence. Our records come from our own readings of the price, so when you look at a chart, you are looking at what we saw, not what a seller says it saw.
We also think tracking should cost you no effort. That is why browser notifications work without sign-up, and why we focus on triggers that match how people really shop: a drop to your target, a return to stock, or a price cut after you have bought, while the return window is still open.
Our advice is simple. Look at the history first, set a target near the low, and let the alert do the waiting. You will buy fewer things on impulse and pay less for the things you do buy. For busy people, that trade is the whole point of price tracking.
Cleaning
Start tracking with BasketPrice
BasketPrice is a price tracking platform that monitors prices across major online retailers, primarily Amazon, and keeps its own record of how each price moves. You can track a specific item, view its history and get a notification when it drops or comes back in stock.
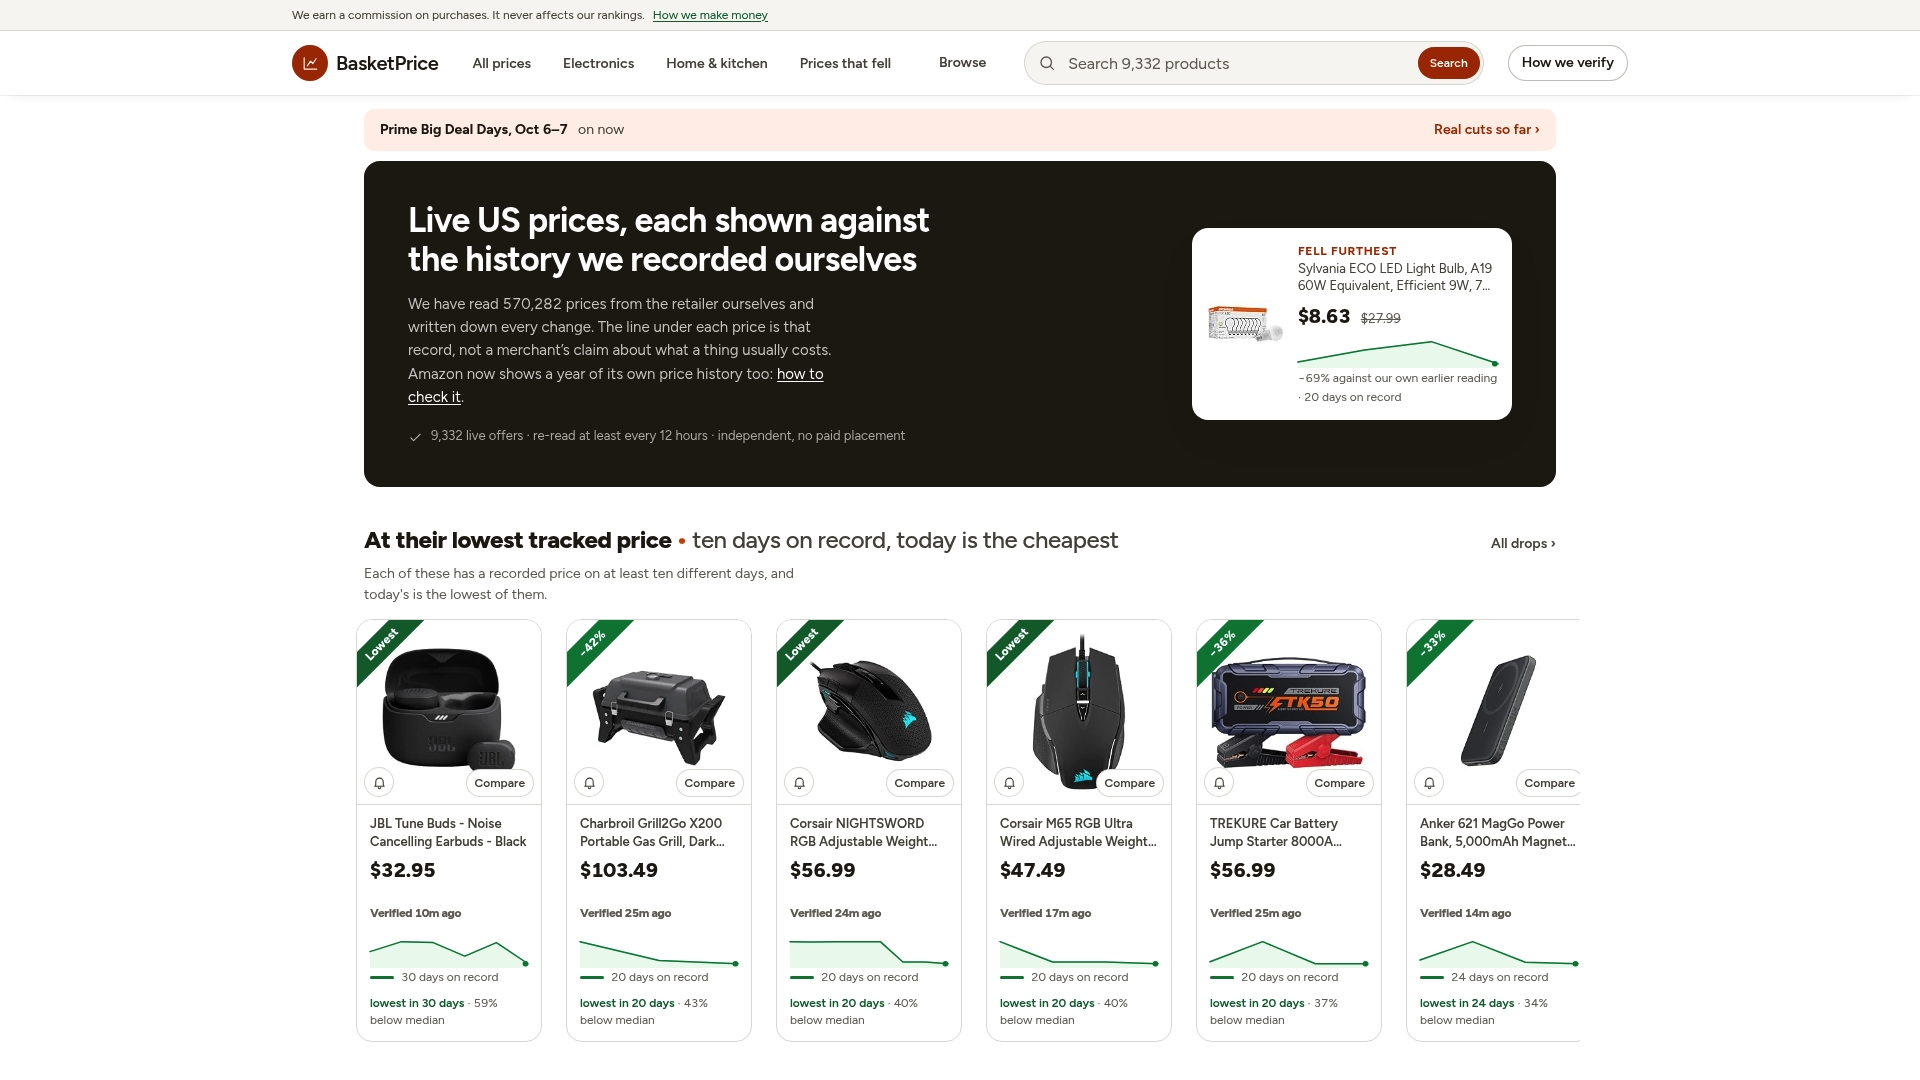
To see it in action, browse the Amazon deals checked against their own price history, look at Amazon price tracking or start from the BasketPrice homepage, where you can explore categories such as Car, Electronics, Home and Sports & outdoors.
FAQ
Is price tracking free for shoppers?
Most consumer price trackers let you view history and set alerts at no charge, and some limit how far back the history goes. At BasketPrice you can get browser price alerts without signing up. BasketPrice earns a commission if you click through to a retailer and buy.
How often do price trackers update?
It depends on the tool. One industry roundup reports that established services typically refresh about once every 24 hours, with more frequent checks for popular items. Check the timestamp on the chart you are reading to see how recent the latest reading is.
Can price history predict the next sale?
Not reliably. History shows where a price has been, and recurring events such as holiday sales and Prime Day often produce dips. But a chart cannot guarantee next week's price, so an alert at your target price is a safer plan than trying to time the bottom.
What is a good price compared with price history?
A price at or near the product's lowest point over the past 90 to 365 days is a strong deal. A price in the middle of the usual range is average, and one near the top is a signal to wait. Always compare against the history, not the crossed-out "was" price.
Does price tracking include coupons and cashback?
Usually it records the listed price only. If you have a coupon, a loyalty discount or card cashback, subtract it yourself at checkout, since a slightly higher listed price can end up cheaper for you.
Sources
- Web Scraping for Price Intelligence (Crawlbase Blog)
- Price Tracking Tools: How They Work and What They Actually Track (BriefScripts)
- Is that advertised discount really a deal? (CBS Philadelphia)
- How Price Tracking Tools Work and How to Use Them (Daily Discount Hub)
- Amazon's hidden price history tool (MakeUseOf)
- What Is Price History? (Racklipedia)
- FTC Guides Against Deceptive Pricing, 16 CFR 233.1 (GovInfo)